1. Joe Model Overview
2023-11-14
a01-joe-model.RmdOverview
The following tutorial provides an overview of running the Joe Model
offline from within R. Users following this tutorial should have R,
RStudio and the R package devtools installed on their
machine.
Installation
At this time the Joe Model R package is hosted on GitHub and can be installed using devtools. Hopefully in the near future the near future the package will be available on R-CRAN for standard installation and loading.
library(devtools)
# install_github("essatech/JoeModelCE")
library(JoeModelCE)
Import Data
There are two input datasets needed to run the Joe Model The Joe Model requires two key datasets, a stressor-response workbook and a stressor magnitude workbook. The stressor-response workbook… and the stressor magnitude workbook…
Stressor Response Workbook
The stressor-response Excel workbook must follow a standardized
format. The first worksheet should be titled Main.
Main Worksheet
TODO placeholder text
| Stressors | Stressor_cat | Interaction | Linked | Stress_Scale | Function | Life_stages | Parameters | Units | Model |
|---|---|---|---|---|---|---|---|---|---|
| Aug_flow | Aug_flow | Minimum | A | linear | continuous | adult | NA | NA | Joe Model |
| Barrier_dams | Barrier_dams | NA | NA | linear | step | adult | NA | NA | Joe Model |
| BKTR | BKTR | NA | NA | linear | continuous | adult | NA | NA | Joe Model |
| Feb_flow | Feb_flow | Minimum | A | linear | continuous | adult | NA | NA | Joe Model |
| Foot_flow | Foot_flow | NA | NA | linear | continuous | adult | NA | NA | Joe Model |
TODO describe the columns in the workbook
- Stressors Name of the stressor…
- Stressor_cat Name of the stressor category (only relevant to population model)…
- Interaction Can be either blank or NA with the default of multiplicative, ‘Additive’ or ‘Minimum’…
- Linked For variables with minimum interaction…
-
Stress_Scale Can be either
'linear'or'logarithmic'… -
Function Can be either
'continuious'or'step'… -
Life_stages Can be either
'fry_parr','alevin','sub_adult'or'adult',… -
Parameters Can be blank or NA (default), which
implys the relationship is for system capacity or linked to a vital rate
'survival','capacity'…
Stressor Dose-Response Worksheets
TODO placeholder text
After the stressor response Excel workbook then must have individual
worksheets for each of the stressors after the Main sheet.
Please ensure that the spelling is identical between the
Stressors column in the Main sheet and the
work sheet name for each stressor.
Each doese response curve is provided on a seperate worksheet. The example below shows the dose-response curve of water temperature (C) and the Adult system capacity.
| Temperature | Mean System Capacity (%) | SD | low.limit | up.limit |
|---|---|---|---|---|
| 12 | 60 | 15 | 10 | 80 |
| 14 | 80 | 10 | 30 | 95 |
| 16 | 100 | 10 | 40 | 100 |
| 18 | 95 | 10 | 40 | 100 |
| 20 | 30 | 5 | 0 | 50 |
| 22 | 15 | 3 | 0 | 30 |
| 24 | 0 | 0 | 0 | 0 |
| 26 | 0 | 0 | 0 | 0 |
| 28 | 0 | 0 | 0 | 0 |
TODO describe the columns in the workbook
- Temperature The first column should be the name of the stressor…
- Mean System Capacity (%) The next column is the mean system capacity (from 0 - 100)..
- SD The third column is the standard deviation for the mean system capacity. This is useful to represent uncertianty in the relationship. For example, a temperature of 12C will not always equate to a system capacity of exactly 90%…
- low.limit Lower limits for the cumulative system capacity…
- up.limit Upper limits for the cumulative system capacity…
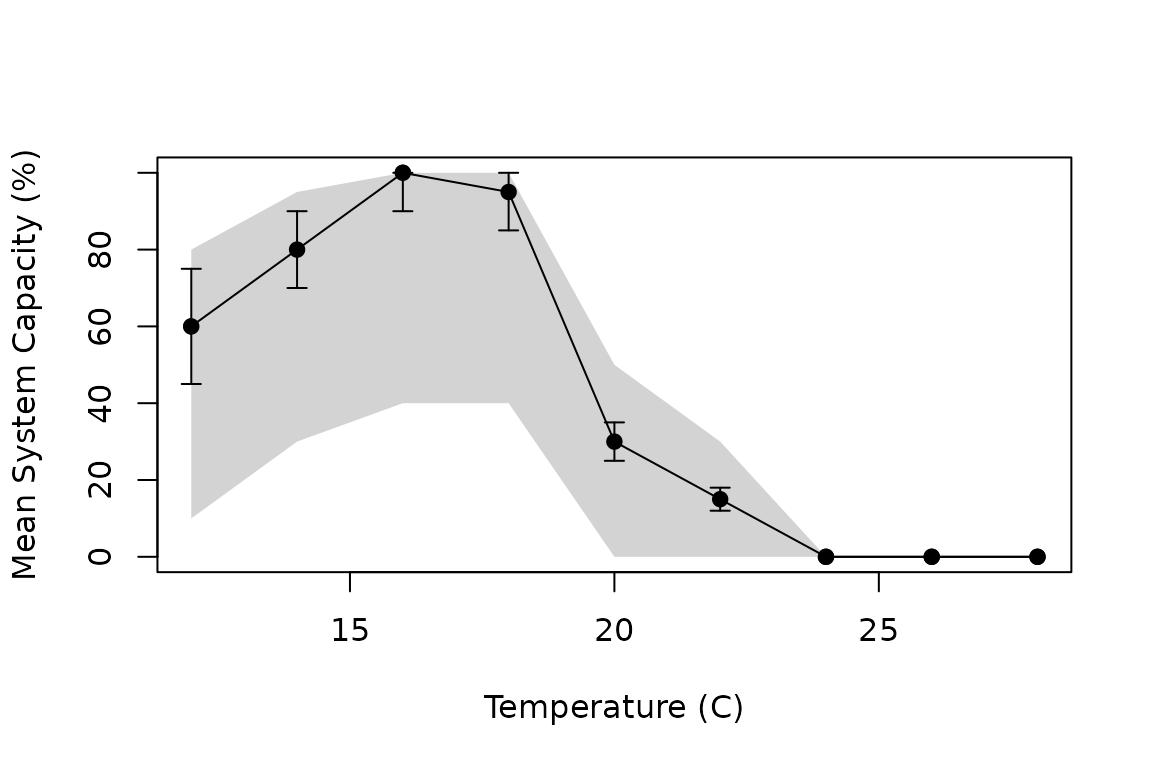
Example Stressor-Response Curve
The figure above shows a stressor response curve. The raw values of the stressor are plotted on the x-axis and the mean system capacity is showen on the y-axis. For each stressor and each simulation values for the mean system capacity will be drawn from a normal distribution with a mean and standard deviation (error bars) bound by the lower and upper limits (grey shading).
  # Load default file from Joe Model Package
  filename_sr <- system.file("extdata", "stressor_response_fixed_ARTR.xlsx", package = "JoeModelCE")
  # Use the StressorResponseWorkbook() function from the JoeModelCE package to format the data and check for errors and issues
  sr_wb_dat <- StressorResponseWorkbook(filename = filename_sr)
  names(sr_wb_dat)
#> [1] "main_sheet"     "stressor_names" "pretty_names"   "sr_dat"
Stressor Magnitude Workbook
Shows the actual values for each location of interest…
| HUC_ID | NAME | Stressor | Stressor_cat | Mean | SD | Distribution | Low_Limit | Up_Limit | Comments |
|---|---|---|---|---|---|---|---|---|---|
| 1702010107 | Name… | Aug_flow | Aug_flow | 100 | 0 | normal | 100 | 0 | NA |
| 1702010107 | Name… | Barrier_dams | Barrier_dams | 0 | 0 | normal | 0 | 5 | NA |
| 1702010107 | Name… | BKTR | BKTR | 0 | 0 | normal | 0 | 100 | NA |
| 1702010107 | Name… | Feb_flow | Feb_flow | 100 | 0 | normal | 100 | 0 | NA |
Column names should be as follows:
- HUC_ID Unique (numeric) identifer for a location of interest. Formally from Hydrologial Unit Code (HUC) representing unique subbasins, but can be anything…
- NAME Name (character) of a given location. Note that this column is used for display purposes only…
- Stressor Name of the stressor. Note that this mutch match the spelling used in the stressor response workbook…
- Stressor_cat Name of the Stressor ctegory. Note that this mutch match the spelling used in the stressor response workbook…
- Mean Mean value for the specific location…
- SD Standard deviation for the specific stressor for that location. The value of each stressor and combination will be resampled for each simulation…
-
Distribution Resampling distribution either
'lognormal'or'normal'… - Low_Limit Lower limits for the locaiton-speific stressor…
- Up_Limit Upper limits for the locaiton-speific stressor….
  # Load default file from Joe Model Package
  filename_rm <- system.file("extdata", "stressor_magnitude_unc_ARTR.xlsx", package = "JoeModelCE")
  # Use the StressorMagnitudeWorkbook() function from the JoeModelCE package to format the data and check for errors and issues
  smw <- StressorMagnitudeWorkbook(filename = filename_rm, scenario_worksheet = "natural_unc")
  names(smw)
#>  [1] "HUC_ID"       "NAME"         "Stressor"     "Stressor_cat" "Mean"
#>  [6] "SD"           "Distribution" "Low_Limit"    "Up_Limit"     "Comments"
Cumulative System Capacity
TODO placeholder text … Run the cumulative system capacity for a single watershed
# Stressor Response Workbook object = sr_wb_dat

# Run the mean_Response() function to create response curves.
# Note that this intermediate object is need throughout
mean.resp.list <- mean_Response(
  n.stressors = nrow(sr_wb_dat$main_sheet),
  str.list = sr_wb_dat$sr_dat,
  main = sr_wb_dat$main_sheet
)

# Set up objects for system capacity function - for "Temperature_adult"
f.main.df <- sr_wb_dat$main_sheet[which(sr_wb_dat$main_sheet$Stressors == "Temperature_adult"), ]
f.stressor.df <- sr_wb_dat$sr_dat[["Temperature_adult"]]
f.mean.resp.list <- mean.resp.list[[which(sr_wb_dat$main_sheet$Stressors == "Temperature_adult")]]

# Stressor Magnitude: Make up fake data for a sample watershed (e.g., HUC_ID: 1701010208)
smw_sample <- data.frame(HUC_ID = 0, NAME = "Location Name",
                      Stressor = "Temperature_adult", Stressor_cat = "Temperature",
                      Mean = 14, SD = 3, Distribution = "normal",
                      Low_Limit = 4, Up_Limit = 20)

# ?SystemCapacity # Preview help function

test_sc <- SystemCapacity(f.dose.df = smw_sample,
                          f.main.df = f.main.df,
                          f.stressor.df = f.stressor.df,
                          f.mean.resp.list = f.mean.resp.list,
                          n.sims = 100)
names(test_sc)
#> [1] "sys.cap"  "dose"     "dose.mat"

# Look at system capacity for one variable and one stressor
sys_cap <- round(test_sc$sys.cap * 100, 3)
hist(sys_cap, xlab = "Mean System Capacity (%)")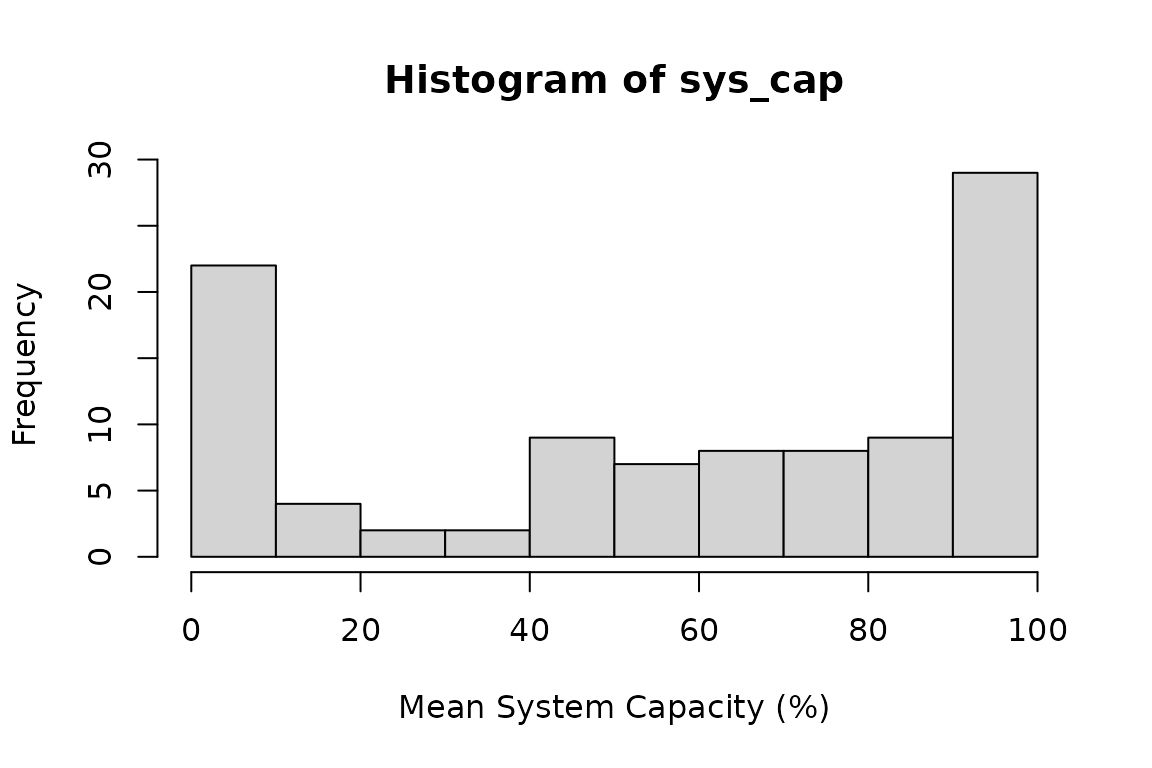
Mean System Capacity for temperature for a hypothetical watershed
Joe Model
TODO placeholder text What about all variables and all stressors - run the full Joe Model…
# Import of stressor response and magnitude workbook
filename_rm <- system.file("extdata", "stressor_magnitude_unc_ARTR.xlsx", package = "JoeModelCE")
filename_sr <- system.file("extdata", "stressor_response_fixed_ARTR.xlsx", package = "JoeModelCE")

dose <- StressorMagnitudeWorkbook(filename = filename_rm, scenario_worksheet = "natural_unc")
sr_wb_dat <- StressorResponseWorkbook(filename = filename_sr)

# ----------------------------------------------------------
# Run the Basic Joe Model
jmr <- JoeModel_Run(dose = dose, # Stressor Magnitude Object
                    sr_wb_dat = sr_wb_dat, # Stressor Response Object
                    MC_sims = 10 # Number of Monte Carlo simulations
                    )
names(jmr)
#> [1] "ce.df"      "sc.dose.df"
# ce.df = Mean system capacity for each HUC_ID for each simulation
# sc.dose.df = Mean system capacity for each variable for each HUC_ID for each simulation
msc <- jmr$ce.df$CE * 100
hist(msc, xlab = "Mean System Capacity (%)", main = NULL)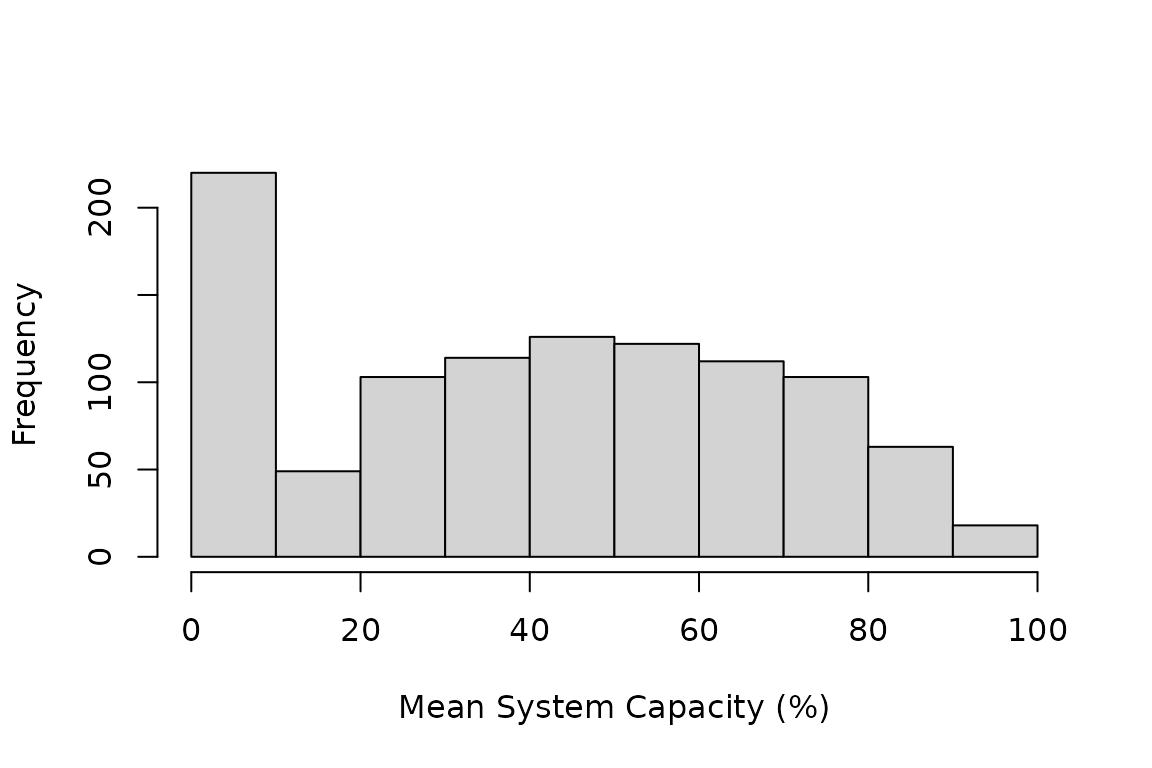
Mean System Capacity for all stressors and all watersheds across all simulations